Appropriateness of Using Daily Positive Cases to Predict the Trend of Covid-19
30/06/2020 Views : 305
IDA BAGUS WINDIA ADNYANA
Recently, we get a daily release of data on the development of new cases of
COVID-19. This is good, because it shows the transparency of the government in
handling this case. For some people, this situation is more or less like a football league
fan waiting every day for his favorite club's score and standings. If the total
of new cases are small, psychologically, the community will be happy, and hope
this continue until the outbreak cease to zero. But on the contrary, if the total of new cases
are high, concerns arise that the outbreak will last long. If the total of new
cases is consistently high, some people even will assume that it is, probably,
a sign that the second wave has entered, which can be more dangerous than the
first wave. But is that right? Let's learn from the West Nusa Tenggara Province
(WNT), by looking at the data below, obtained from the official release of the
WNT Covid-19 Task Force.
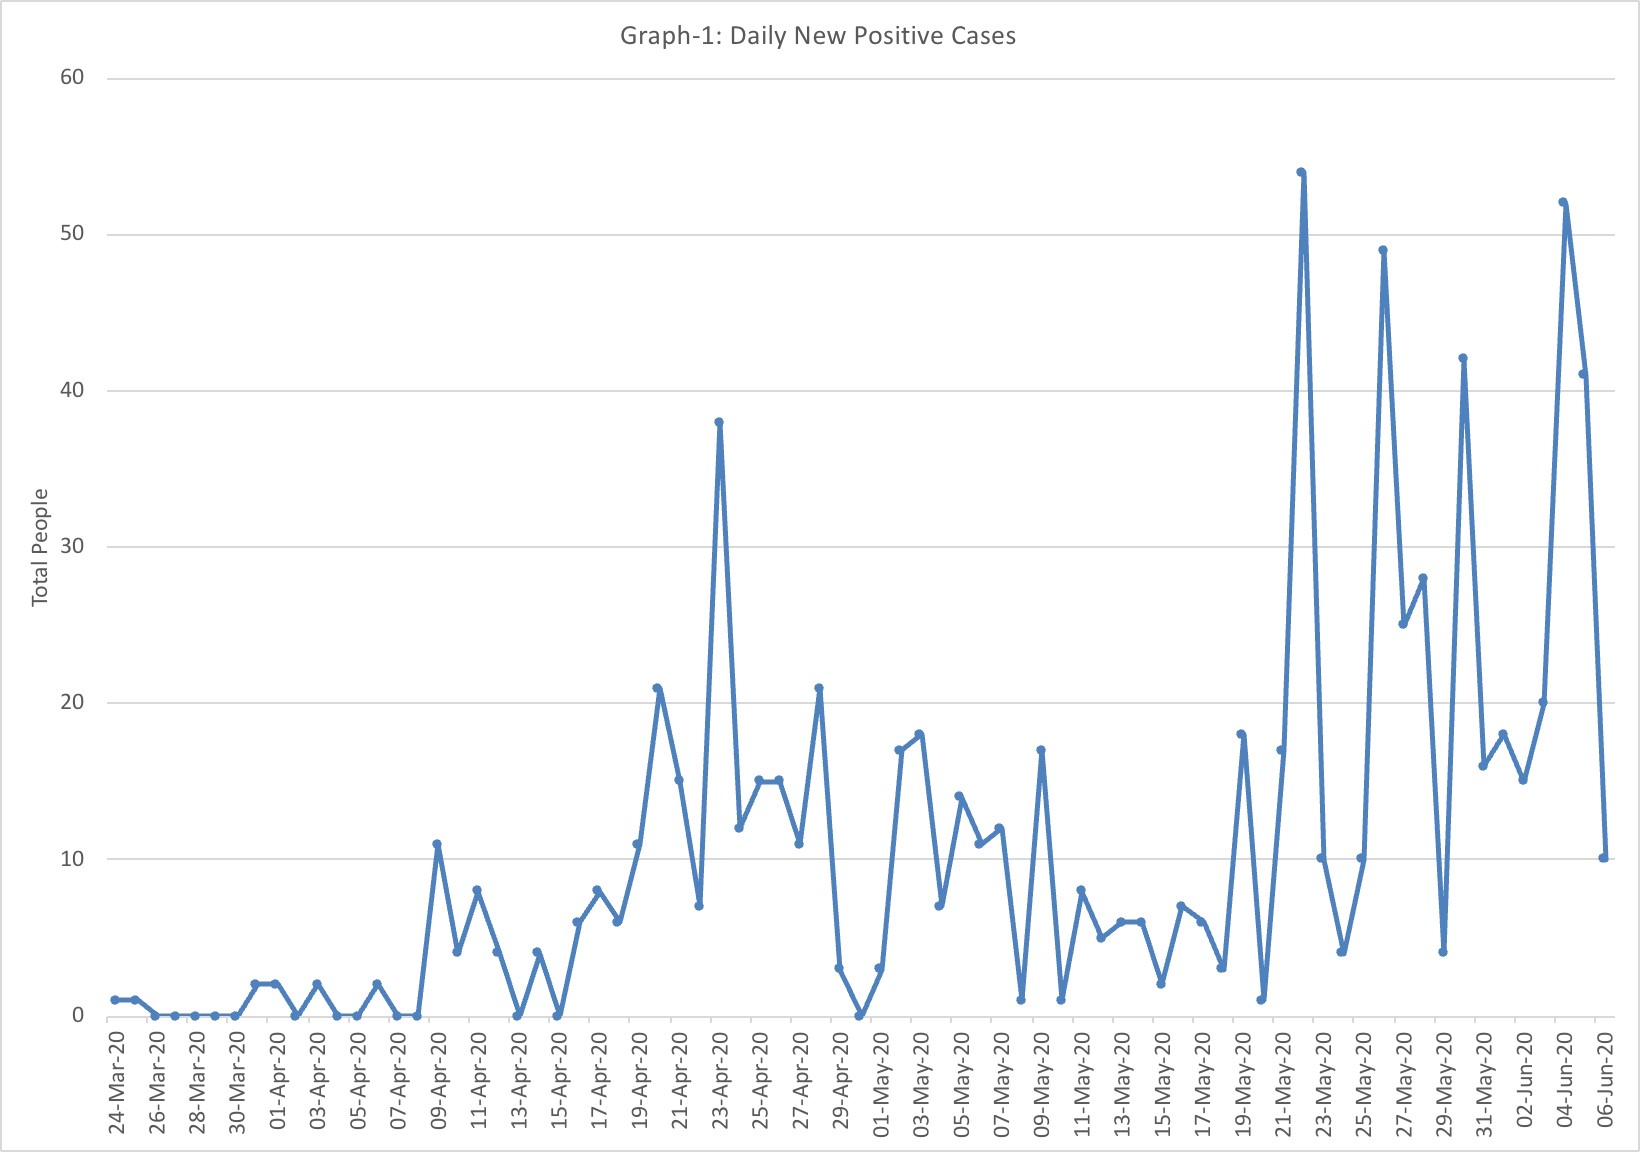
Graph-1 showed the trend of total daily positive cases in WNT from March 24, 2020
(confirmation of the first case) to June 6, 2020. Initially, cases were
fluctuating but tended to rise until reached its peaked on April 23, 2020. Then there was a
decline to May 18, 2020, which was soon followed by relatively high eruptions
of daily positive cases, which was even higher than the cases on April 23. Does Graph-1 showing the actual or real daily new cases? Does it indicate if WNT has entered the second
wave? To answer this, let's look at the other graphs.


Positive
cases presented in Graph-1 were obtained from RT-PCR tests
conducted by several laboratories in WNT. The
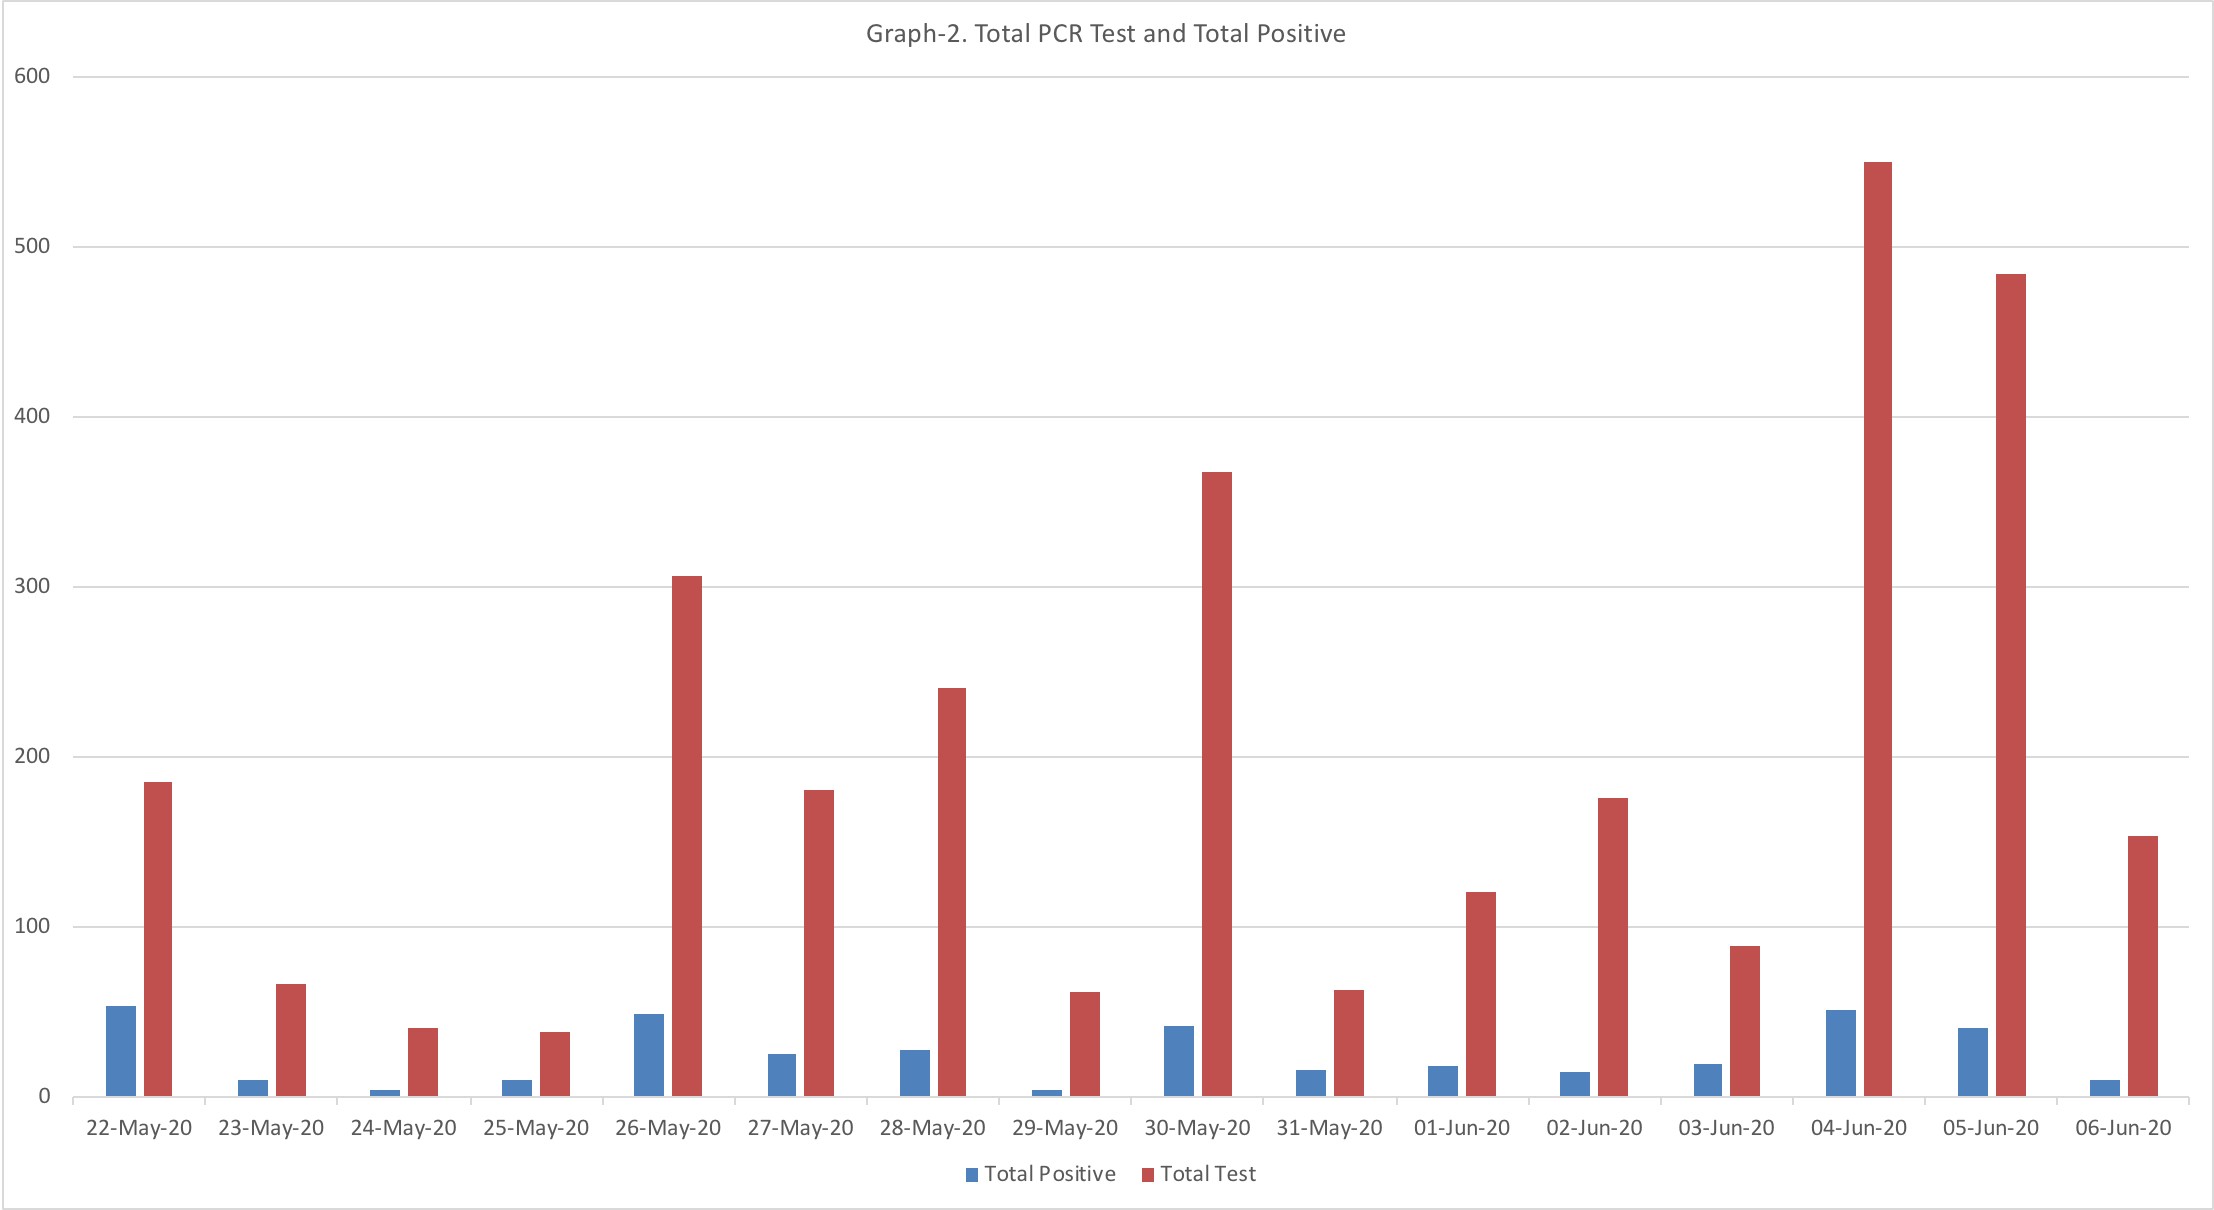
total of PCR tests that have been carried out in WNT from 6 April 2020 - 6 June 2020 are 7266 tests. Let's focus on data on
the number of PCR tests per day for the past 2 weeks and the number of positive
cases found (Graph-2). At first glance, it
appears that the more test
conducted (red bars), the more
the number of new positive cases (blue bars). This was even clearer when we saw the Graph-3. In this last chart, it appeared that the number of tests was
positively correlated with
the number of daily new positive COVID-19 cases. The correlation
coefficient (r) was 0.91, indicates a very strong association, and there was no better explanation to explain this association. In plain language, the ups and downs of
positive cases reported in the release over the past 15 days, depending on the
number of PCR tests conducted. If there were many
tests, there would be many positive ones, and vice versa. Thus,
it would be very misleading if the trend
of the daily cases was used
to predict the development of this outbreak in WNT.
Based on
simple calculations, the number of RT-PCR tests carried out to find one
positive case is between 4-15 tests, with an average of 9 ± 4 (SD).
In the
future, the things
that should be done, perhaps,
is to increase the number of PCR
test per day, to make it into e.g. 500 test per day. This is important to
ensure the status of all high-risk groups such as patients
under surveillance, person in monitoring, asymptomatic
carrier, and the traveller without symptom. If the total number of
samples examined per day is fluctuating and relatively small, the data will be less meaningful, and our responses (tracing
and isolating the positive cases) would be far behind the speed of spread of this virus.
Theoretically, the sooner all risk groups are tested, the faster the isolation
action can be taken (for those who are positive), so that the spread of disease
can be minimized (WA).
