PREDICTION OF THE ENDING OF THE SPREADING OF COVID-19 IN INDONESIA
29/06/2020 Views : 473
Made Sumadiyasa
Nearly three months we are in an uncertainty,
especially in an area of social and economy because of the impact of the
uncertainty of the spread of co-19 will end. As a result, decision
makers/policies often seem hesitant to make decisions. The decision that
involves a lot of people needs to think about all aspects that will be
influenced by the decision. Decisions/policies taken now can determine the life
to come. In the context of the covid-19 pandemic, predictions are needed which
can help the decision makers prepare strategic steps in the response to the
covid-19 pandemic. With the right prediction when covid-19 will end, we hope
the government can make policies that can keep the socio-economic movement of
the people.

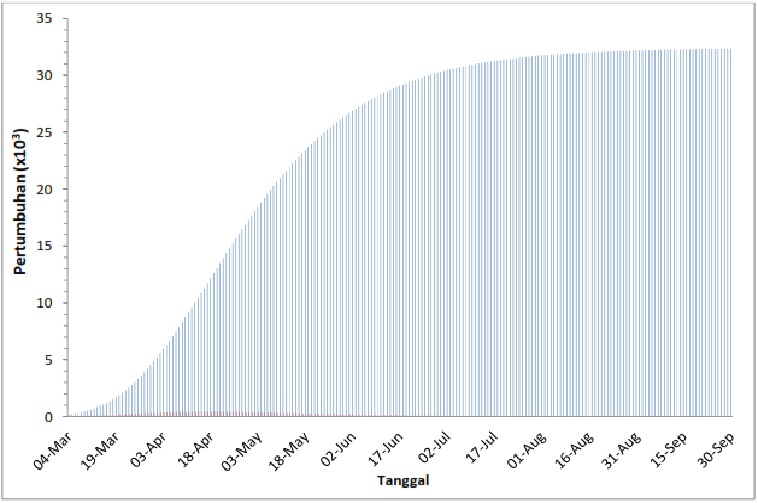
Figure 1. Positive confirmed growth of Covid-19 data from 4 March – 20 May 2020

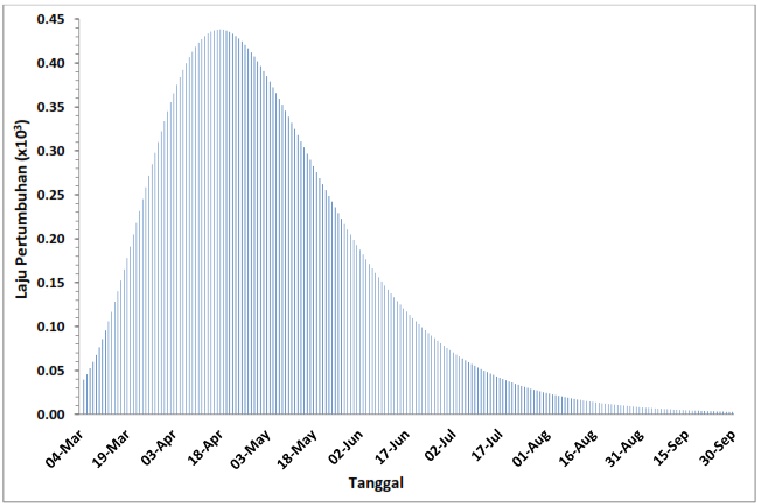
Figure 2. Modeling of the positive confirmed Covid-19 growth rate from 4 March 4 – 20 May 2020
Predictions
that are made based on mathematical modeling, to get the right modeling
accurate data is needed by considering various parameters, such as community dynamics,
the amount of data recorded (data from laboratory test results), the level of
community vulnerability to viruses. If there is a change in those parameters
significantly, it can result in changes in the data so that the modeling
becomes changed too.
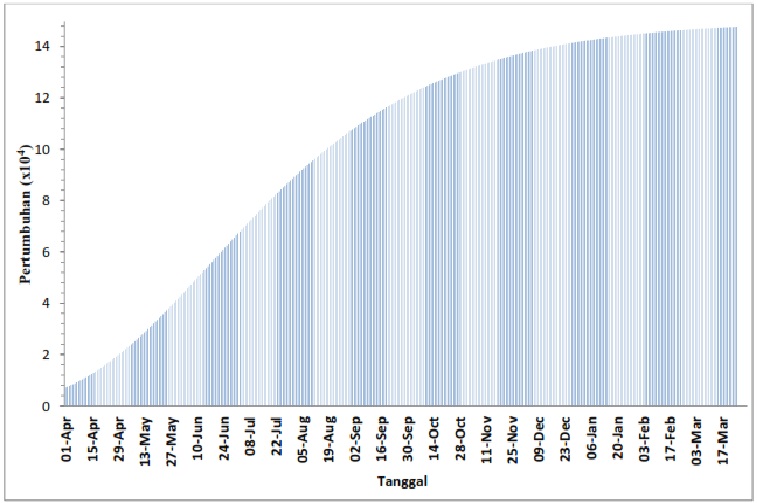
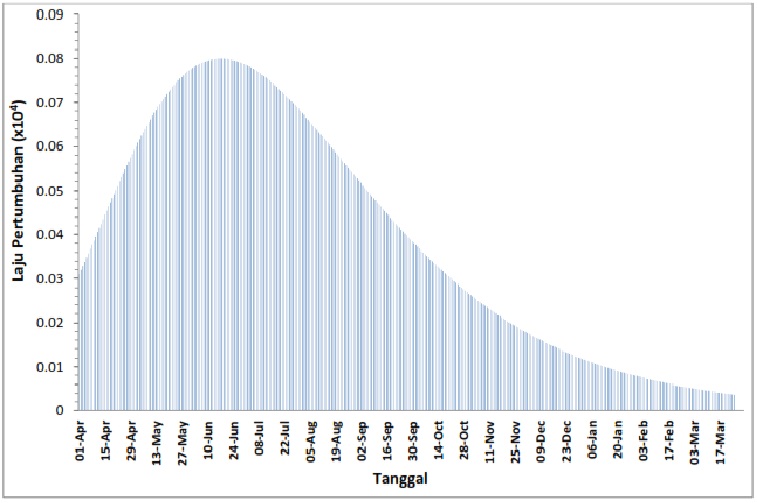
As happened later, there was a change in policy and resulted in changes in the dynamics of the movement of society without the implementation of strict health protocols. There is an increase in capacity to carry out tests so that the amount of data recorded every day increases. As a result, an increased very sharply of the data positive confirm covid-19 occurred. This affects the modeling, and if using data from 1 April 2020 to mid-June, a predictive picture like Figure 3 and 4 are obtained. From Figure 3 it appears that until March 2021 the curve is still rising. This means that it is estimated that by March 2021 there will still be confirmed Covid-19 significantly. This is made clear in Figure 4, the growth rate is estimated to start to decline in July 2020, but until March 2021 covid-19 is still not over.

Figure 3. Covid-19 positive confirmed growth data from 1 April - 15 June 2020

Figure 4. Modeling of the positive confirmed Covid-19 growth rate from 1 April - 15 June 2020.
From the prediction model,
it can be seen that the prediction modeling will change if there is a change in
the amount of daily data positive confirm covid-19. This is related to changes
in community dynamics and the ability to conduct covid-19 testing. What is
needed is an effort to prevent maximized transmission, inhibit transmission by
reducing the possibility of inter-human virus transmission. Predictions based
on mathematical modeling and objectively aimed data are basically not really
exact because to complex, dynamic and heterogeneous world reality.
